Circuitry
The beacon sensor uses the natural capacitance of the transistor with a really large resistance to create a signal that does not get a chance to stabilize. When we are looking at a high pulse, we see a rising signal; at a low pulse, we see a decaying one. When the time constant is slow enough you basically get a triangle wave. We then take an RC derivative of the signal and amplify that, so that at the start of the decay or exponential rise, when the slope is the biggest, we hit the rail of the op-amp. We then use a Schmitt trigger with a band that is almost as large as the op-amp rails. This reliably finds the change in signal event and is not appreciably sensitive to distance.
Click here to view the eye board schematic in a new window.
For the beacon detector, we want the maximum gain on the sensor to see far, and we also want to make sure that we almost never reach our high and low asymptotes on the RC setup by the photo-transistor.
The photo-transistorís capacitance is not given on the datasheet, but we measure the rise time of the circuit to be well above the period of the beacons. In the next stage, we amplify the derivative of the signal by Res2 * C1 = 0.0022. We get about 0.5V change in 0.25msec = 500V/sec which should be 4.4V on the output, railing the op-amp output (which is what we want). We then pipe that into a comparator to look for the rail of the op-amp. The op-amp is guaranteed to 3.5V on the top rail and very close to ground.
We want the hysteresis band to be about 0.5V to 3.5V. With 10K on each, we get VHIGH = 3.33V and VLOW = 1.5V, which is pretty close for now, and we have those resistors handy.
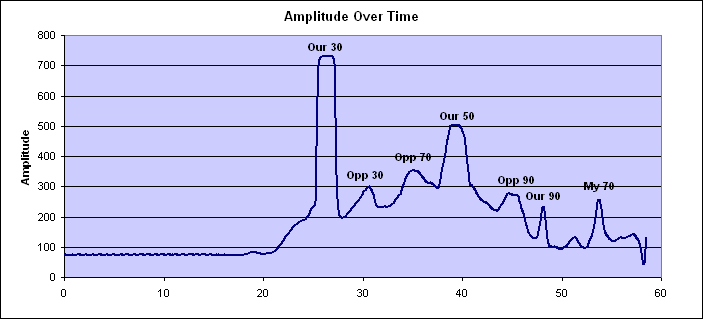
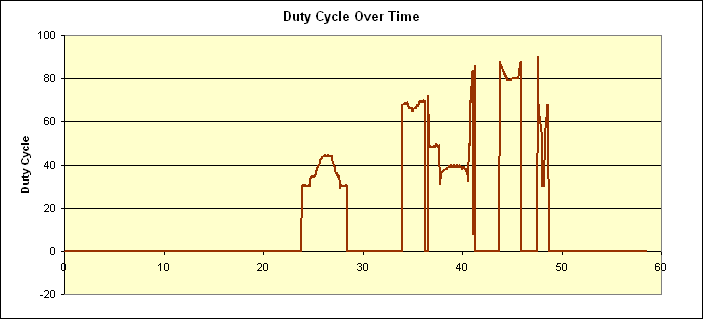
The amplitude sensor takes the buffered signal from the phototransistor and runs it into a peak follower with an RC drain. This means that the signal closely follows the peak of the triangle wave. We read this into a A/D port and now have two pieces of information about what we see: a duty and a strength. We use the strength to do things like beacon homing and rejecting the 30 beacon we start next to.
Below are plots of the amplitude and duty we see when we spin from the starting box. The readings were collected during one complete counter-clockwise rotation over one-minute. Notice that the duty is not really nice, but can be combined with amplitude information (for example, ignoring any signal above or below a particular threshold) to accurately and realiably tell beacons apart.


